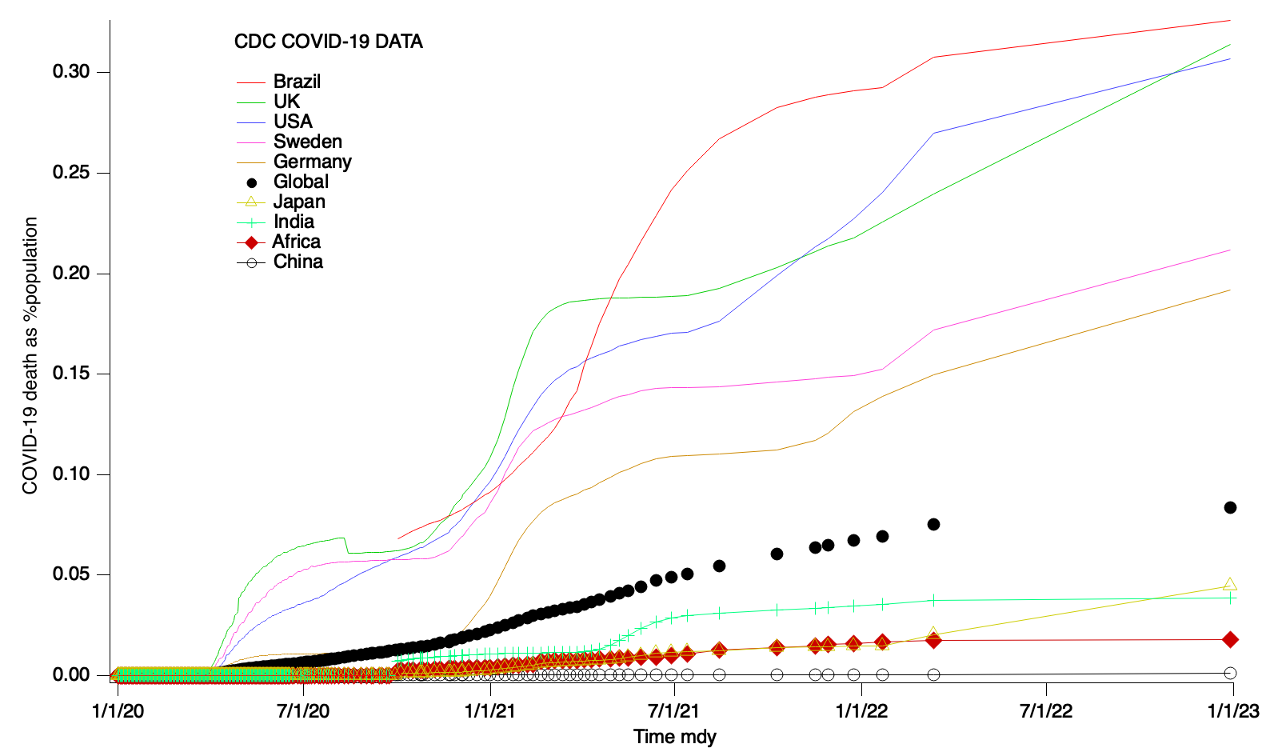
COVID-19 DEATH TRACKER.
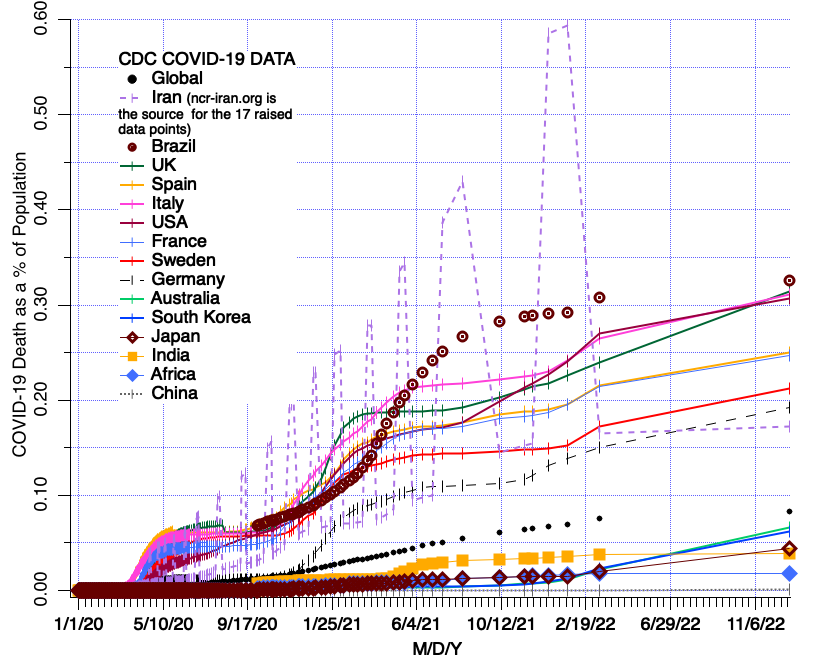
COVID-19 deaths (vertical, left axis) as a percent of the population for 15 countries. The bottom axis is time from January 1st 2020 to the present.
The data in the graphs below were updated on the December 31st 2022.
Initially in early 2020 all countries had a high death rate shown by the steep curve slopes, then in the summer months of 2020 it decreased until late in 2020.
Please feel free to copy the graphs – you are welcome to use the data.
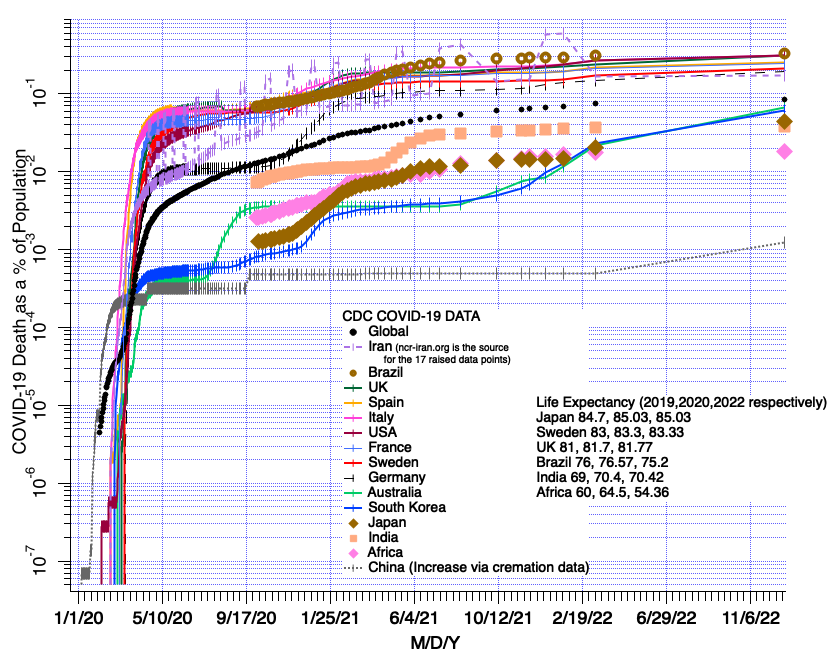
Each month a linear and/or log graph are present and /or a simpler graph with less countries. The log graph when death numbers were low in January 2020, can be used to see the first events in the COVID-19 pandemic.